King County Housing Activity Shows Strong YoY Gains in Pending Sales, Prices
April 9, 2024
Slight improvement in new listings and total inventory compared to twelve months ago across the 26 counties served by Northwest Multiple Listing Service contributed to a small uptick in pending sales (1.15%) during March. Nonetheless, the volume of year-over-year (YoY) closed sales fell 11.2%.
The NWMLS report summarizing March activity shows the value of completed transactions was more than $4.1 billion. Of this total, nearly 88.9% was for sales of single-family homes, with condominiums accounting for the remaining 11.1%.
New listings increased by only 124 properties (about 1.5%) during March compared to the same month a year ago. Total inventory also notched a small gain with 93 more active listings (up 1.16%) than a year ago.

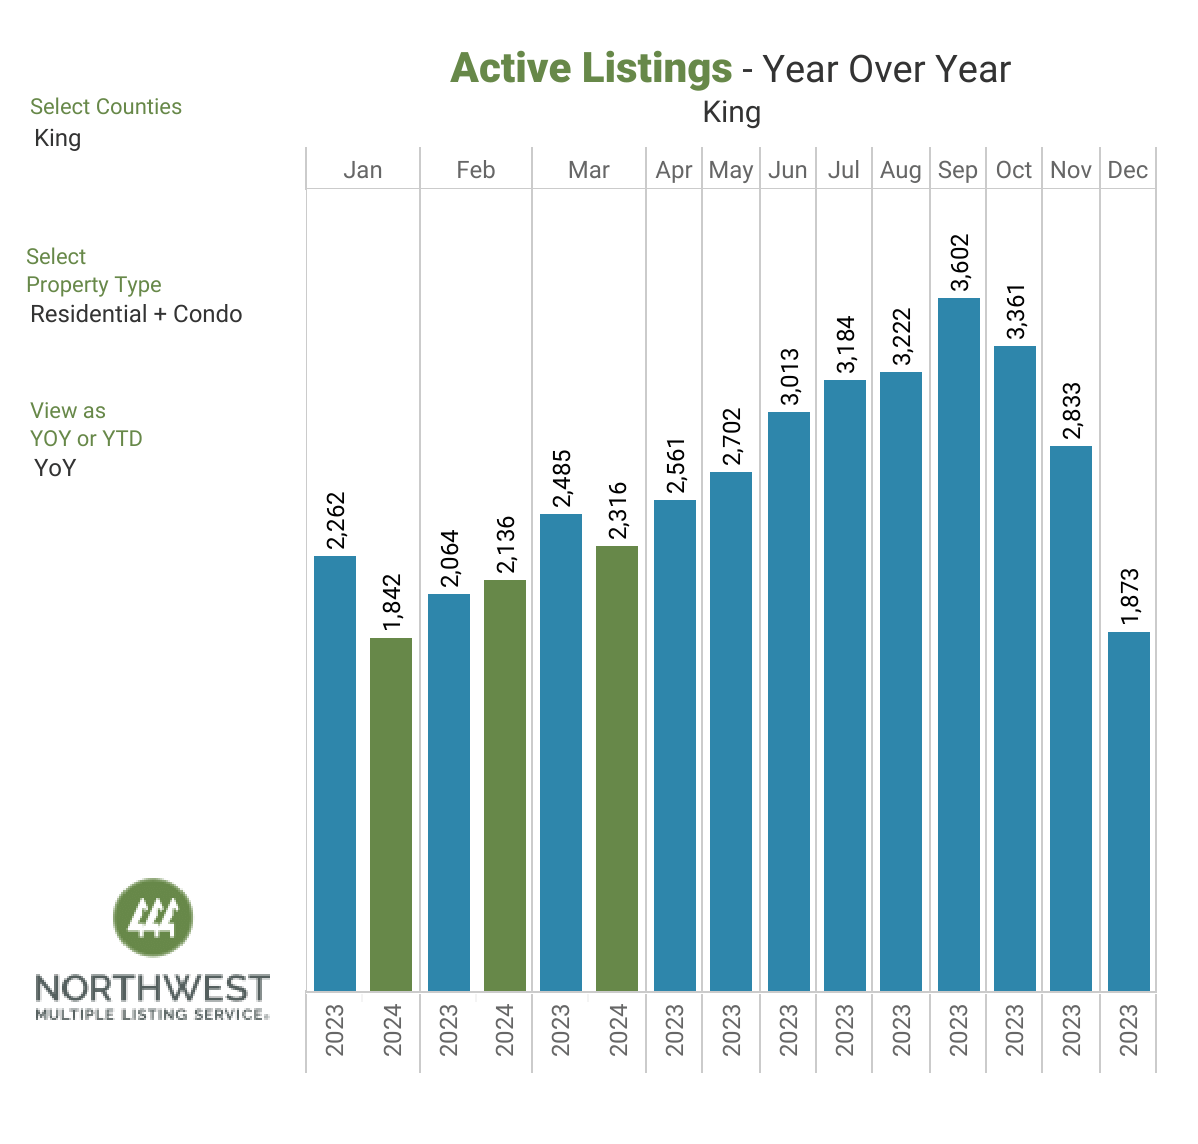
In King County, the volume of new listings was about the same as a year ago (2,954 versus 2,947), while the number of active listings fell from the year-ago total of 2,485 to 2,316 (down 6.8%).
Industry experts point to mortgage rates as an impediment to activity.
“Mortgage rates showed little movement again this week, hovering around 6.8%,” said Freddie Mac Chief Economist Sam Khater. He noted the 30-year fixed-rate mortgage has not reached seven percent since the start of 2024, adding, “but it has not dropped below 6.6% either.”
Data from Freddie Mac shows the 4-week average for a 30-year fixed rate mortgage is 6.81% and the 52-week average is 6.91%.
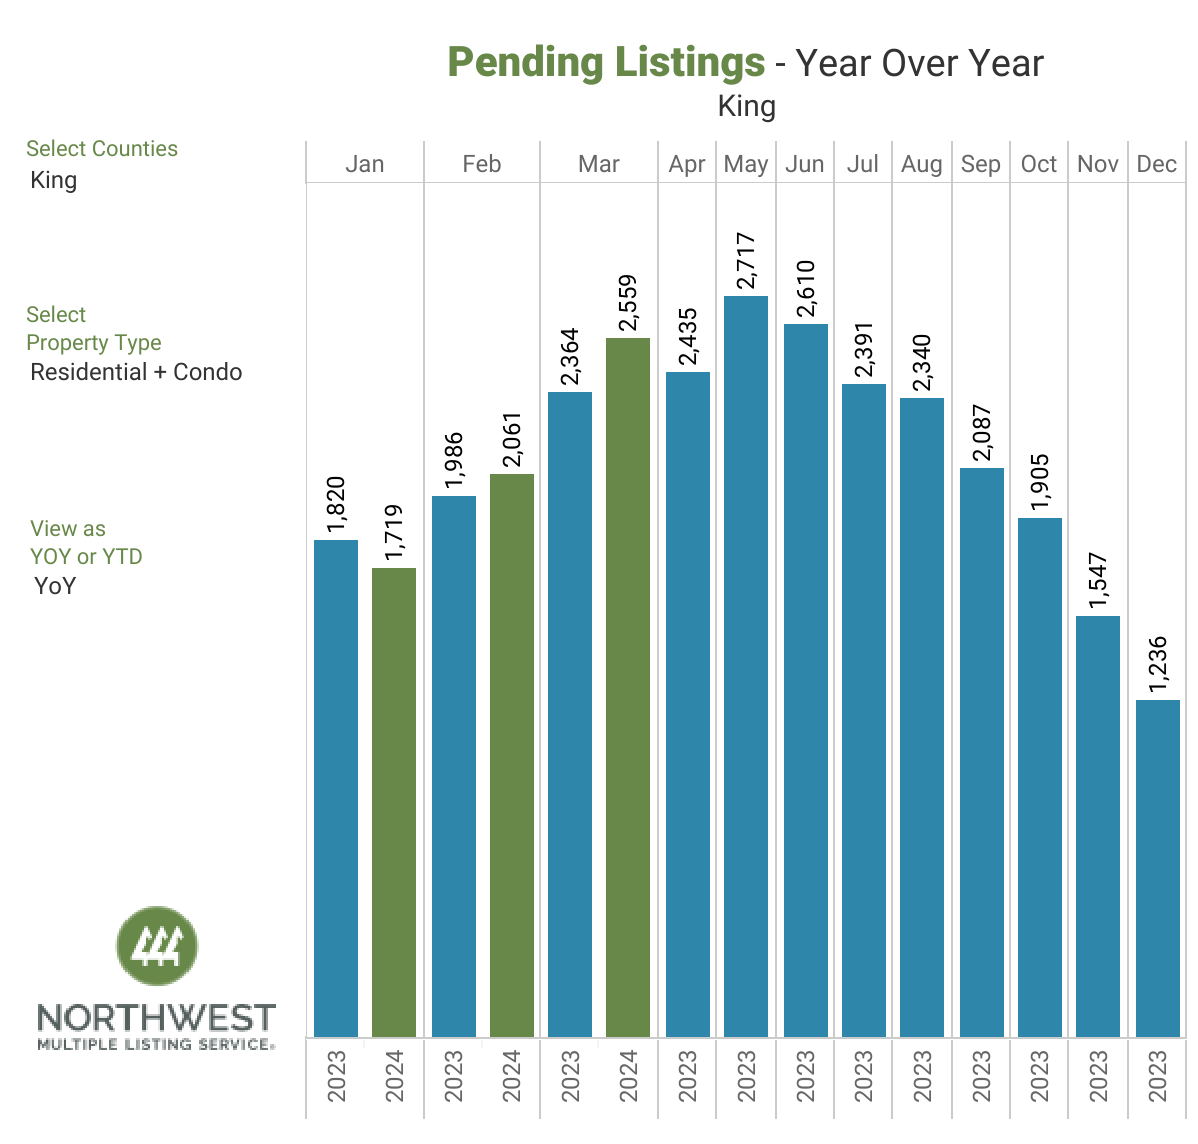
The latest report from Northwest MLS shows totals for some key metrics were brighter in King County when compared to its overall service area. Despite tighter selection, pending sales of single family homes and condos rose 8.25% countywide. Price gains also outperformed the NWMLS systemwide figure.

King County prices were up sharply from a year ago, rising from $760,000 to $850,000 (an increase of 11.84%).
YOY median sales prices rose in 19 of the 26 counties in the NWMLS report. For the MLS overall area, prices were up 7.41% (from $590,000 to $633,717). Median prices ranged from a low of $274,000 in Columbia County to the $850,000 figure reported for sales in King County.
Within the six sub-areas tracked by NWMLS, the most affordable homes were located in Southwest King County encompassing Burien, Des Moines and Federal Way, while the highest price sales were on the Eastside (including Bellevue, Kirkland, Mercer Island Redmond, and Sammamish) where median sales prices ranged from nearly $1.3 million in the Juanita/Woodinville sub-area to nearly $2.3 million on Mercer Island.
Depleted inventory continues to be a factor in rising prices, and a challenge for house-hunters.
Northwest MLS reported 1.57 months of inventory systemwide, with the four counties in the Puget Sound region all having less than that. Snohomish County had less than a month’s supply (0.80), King had 1.23, Pierce had 1.39 and Kitsap had 1.41 months of supply.
The imbalance continued to be reflected in higher prices. The areawide median price for homes that sold last month was $633,717, an increase of 7.4% from the year ago figure of $590,000, and up more than $40,000 from January. King County prices have jumped $90,000 since January.
A comparison of property types that sold last month in King County shows prices for single family homes are surging at a faster rate (12.56% YOY) than prices for condos (6.51% YOY).
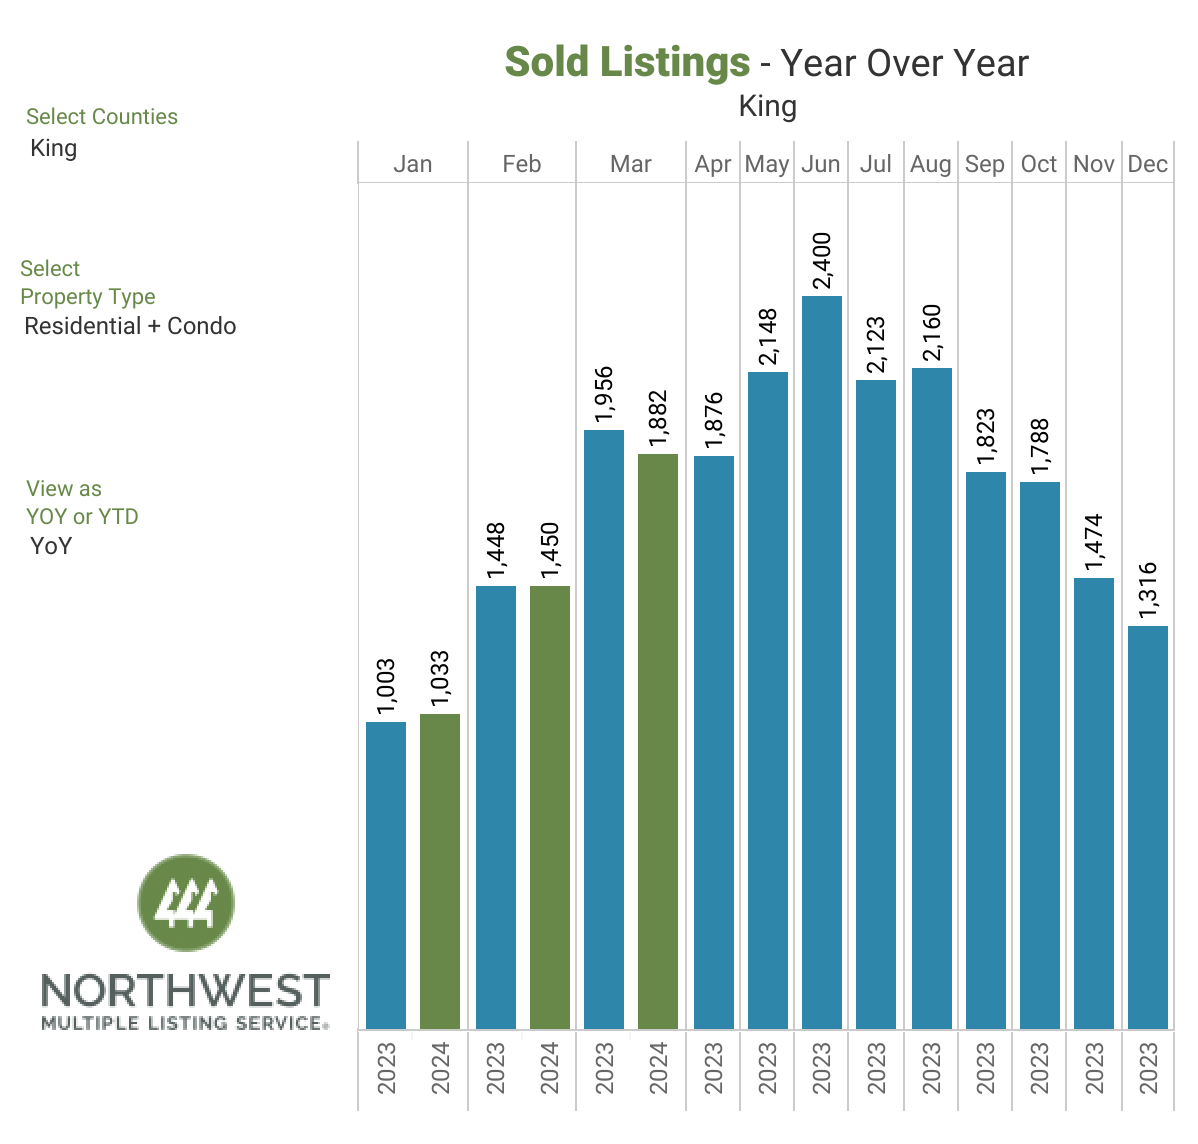
The volume of closed sales across the 26 counties in the NWMLS report decreased 11.2% from a year ago.

NWMLS also provided insights into consumer activities during the month of March 2024:
- The total number of showings scheduled through NWMLS-provided software increased by 4% from February 2024 (106,055 showings) to March 2024 (109,781 showings).
- Keyboxes located at listed properties were accessed 148,536 times in March 2024, a 23% increase from activity in February 2024 when they were accessed 120,303 times.
- Brokers seeking to further assist consumers as they navigate the market are making special note of properties that are eligible for the Down Payment Resource (DPR) program offered by NWMLS. In March 2024, there were 11,513 listed properties that were eligible for this program.
